
Introduction
Demand and supply are the most basic concepts in economics. Almost every market decision, from prices to production, depends on these two forces. Many students find these topics confusing at first, but once you understand the logic behind them, they become very simple. In this article, we will explain demand and supply in easy language, along with examples and simple explanations of graphs.
Understanding the Heart of Economics: A Simple Guide to Demand and Supply
Economics might sound like a complex world of numbers and stock markets, but at its core, it is actually the study of choices. Every time you decide whether to buy a coffee, how much you’re willing to pay for a new phone, or why a shopkeeper decides to stock up on a certain product, you are participating in the dance of Demand and Supply.
These two forces are the “invisible hands” that determine the price of everything around us. Let’s break them down into simple, human terms.
1. What is Economic Demand? (The Buyer’s Perspective)
Think of Demand as the “desire backed by the ability to pay.” It’s not just wishing for something; it’s being ready to pull out your wallet and buy it.
The Law of Demand
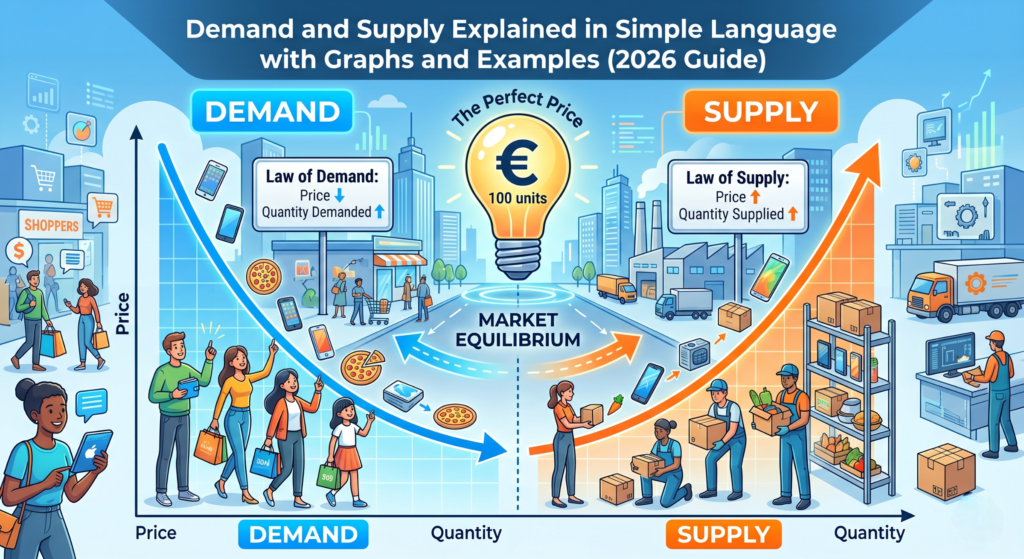
The Law of Demand is based on common sense: The cheaper something is, the more of it people want to buy. Conversely, when the price goes up, people tend to buy less.
In economics, we call this an inverse relationship. When one goes up (Price), the other goes down (Quantity Demanded).
Why does this happen? > 1. The Substitution Effect: If the price of Pizza goes up, you might buy a Burger instead. 2. The Income Effect: If the price of your favorite snack doubles, you simply can’t afford to buy as many as you used to with the same amount of pocket money.
Real-Life Example: The Pizza Scenario
Imagine your local pizza shop.
At ₹100 per slice: You feel it’s a great deal! You might buy 4 slices to share with a friend.
At ₹200 per slice: It’s getting expensive. You decide to buy only 2 slices.
At ₹400 per slice: That’s a luxury! You might skip the pizza entirely or buy just 1 slice as a treat.
As the price climbed, your demand dropped. This is the Law of Demand in action.
2. What is Economic Supply? (The Seller’s Perspective)
Now, let’s switch sides. Imagine you are the person selling the pizza. Your goal is to make a profit. Supply is the amount of a product that a business is willing to bring to the market at a certain price.
The Law of Supply
The Law of Supply states: As the price of a product increases, the quantity supplied also increases. Sellers love high prices because high prices mean more profit. If a product is selling for a lot of money, you’ll work overtime, hire more staff, and produce as much as possible to make the most of that high price.
This is a direct relationship. When the price goes up, the quantity supplied goes up.
Real-Life Demand and Supply examples
At ₹100 per pizza: The profit margin is slim. The baker might only make 10 pizzas a day because it’s barely worth the effort after paying for flour and electricity.
At ₹500 per pizza: Now the baker is making a huge profit! They will wake up earlier, buy a second oven, and try to supply 50 pizzas a day to capitalize on the high price.
3. The Magic Point: Market Equilibrium
If buyers want low prices and sellers want high prices, how do we ever agree on a price? This happens at a point called Equilibrium.
Equilibrium is the “sweet spot” where the quantity demanded by buyers exactly matches the quantity supplied by sellers. At this price, everyone is happy: the shelves aren’t empty (shortage), and there isn’t leftover food rotting in the back (surplus).
Surplus: If the price is too high, sellers produce too much, but no one buys. To fix this, shops hold a “Sale” to lower the price.
Shortage: If the price is too low, everyone wants to buy, but the seller can’t afford to make enough. This leads to long lines and empty shelves, eventually forcing the price back up.
4. Factors That Change the Game
Price isn’t the only thing that affects demand and supply. Sometimes, the entire “curve” shifts.
What shifts Demand?
Tastes and Preferences: If a celebrity starts wearing a specific brand of shoes, demand goes up even if the price stays the same.
Income: If people get a raise at work, they spend more on luxuries.
Related Goods: If the price of coffee goes way up, the demand for tea (a substitute) might increase.
What shifts Supply?
Cost of Production: If the price of petrol or raw materials goes up, it becomes harder to make products, so supply drops.
Technology: A new machine that makes 1,000 shirts an hour instead of 100 will massively increase supply.
Weather: For farmers, a bad drought can destroy a crop, causing the supply of vegetables to plummet.
Pro Tips for Students (Cracking the Exam)
Always Label Your Graphs: In an exam, a graph without labels for “Price” (Vertical axis) and “Quantity” (Horizontal axis) is useless.
Direction Matters: Remember, Demand goes Down (slopes downward). Supply goes Skyward (slopes upward).
Ceteris Paribus: This is a fancy Latin phrase economists use. It means “all other things being equal.” When we talk about the Law of Demand, we assume things like your income or tastes haven’t changed—only the price has.